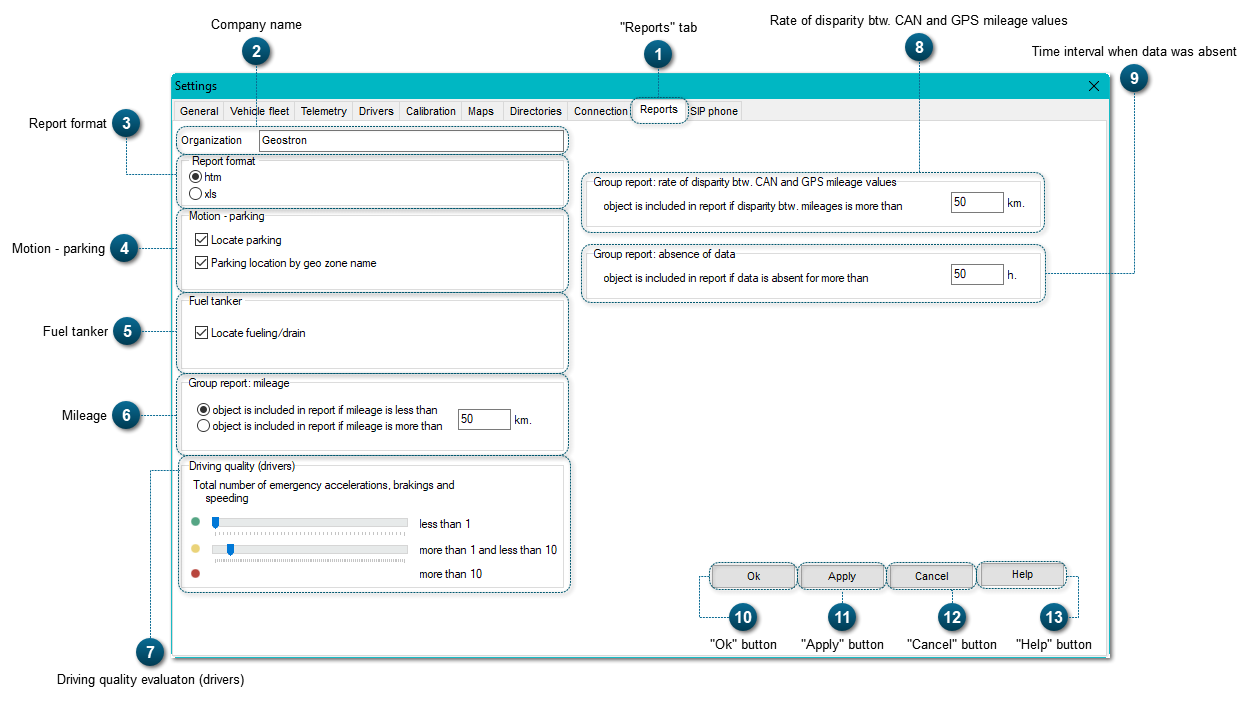
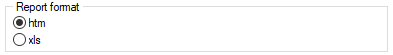
It is necessary to select one of the report formats.
htm: a report in HTML format
xls: a report inMicrosoft Excel format.
When system reports are generated (see the section Report generation) and also when reports from the tab Chart (in the Telemetry Panel) are generated, such reports are saved in the selected format in the corresponding Geostron/Reports directory. To change the directory see the section Directories.
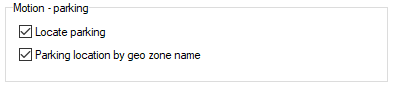
If you select the checkbox of the line Locate parking, then an additional column "Location" is filled in in the group of reports, where the location of each idling/parking point is indicated.
If you select the checkbox of the line Parking location by geo zone name, then an additional column "Location" is filled in in the group of reports, where the geo zone name of each idling/parking location is indicated.
If you select the checkbox of the line Locate fuelings/drains, then an additional column "Location" is filled in in the report generated in the tab Chart. In this column, locations of fuelings and drains are indicated. This setting can only be applied to a fuel tanker.
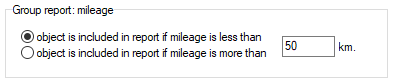
It is necessary to select one of the parameters and input the value (km).
If you select Object is included in report if mileage is less than/Object is included in report if mileage is more than, then this setting will be valid for all the objects, and this setting defines if an object will be included in the system report "Group report: mileage less than...", according to the selected parameter and the value.
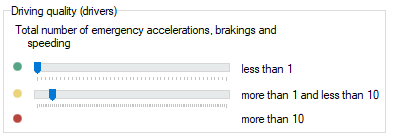
Here the intervals for categorizing the total count of emergency acceleration and emergency braking for 100 km are indicated, to evaluate driving quality. The data is displayed in the report "Group report: driving quality (drivers)".
If the total count of emergency acceleration and emergency braking of a driver is in the first interval, then the column for this driver will be marked as green in the report. It means that the quality of his driving is excellent.
If the total count of emergency events is in the second interval, then it will be marked as yellow in the report.
And if the total count of emergency events is in the third interval, it will be marked as red in the report. It means that the driving quality is unsatisfactory.
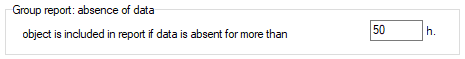
It is necessary to set the max value (h) for the time interval when data was absent. This information will be displayed in the report "Group report: absense of data".