scroll the mouse wheel somewhere in the chart area;
in the chart area, right-click and drag frame area so that you choose some interval. After you do this, the map will be centered on the selected part of the track:
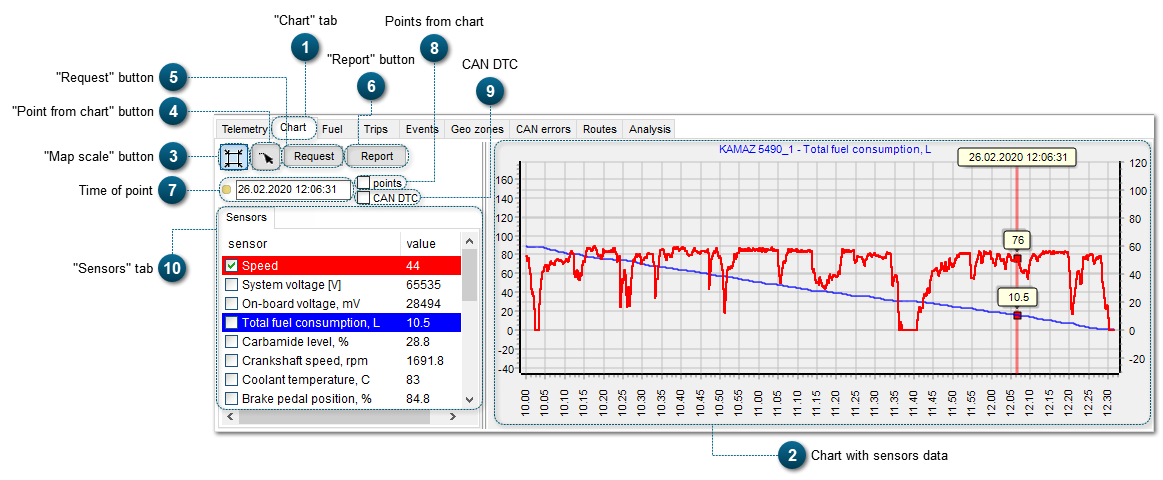
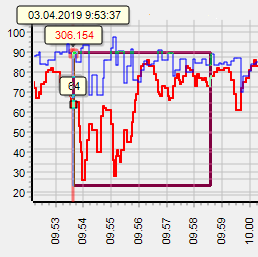
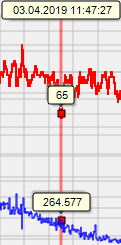
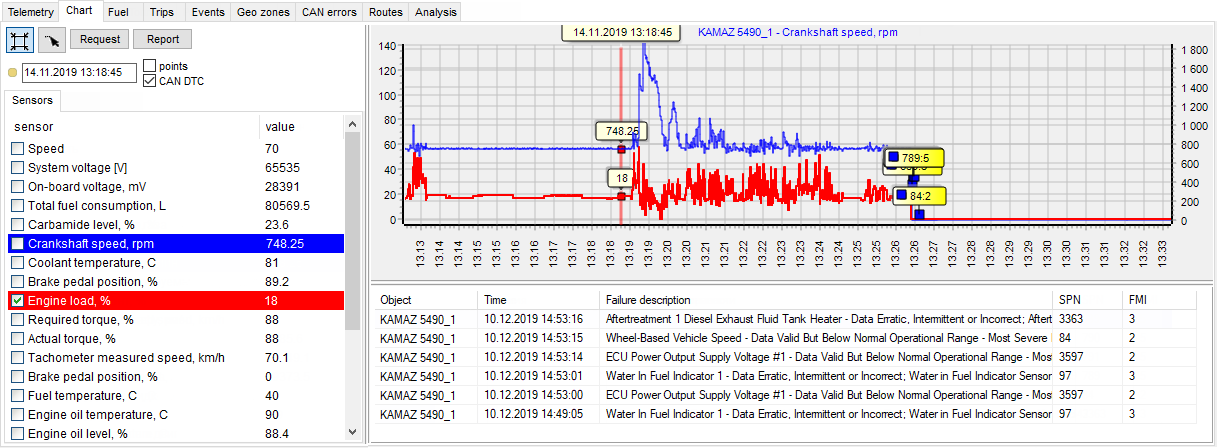
When you move the mouse cursor to the chart, sensor data at the selected time of track is displayed:
When this function is activated: if you move the mouse in the chart of some parameter, object marker is positioned in the corresponding point of the track (object marker follows your mouse cursor). Also, the corresponding table row becomes selected in the Tracktab.
When this function is deactivated: you need to click some place in the chart in order to position the marker there.
Sensors tab contains information about sensors (the sensors that are activated in the Telemetry Panel) and about data from these sensors in the selected point of the track (i.e.at the selected time). See the section Settings - Telemetryto edit the list of sensors.
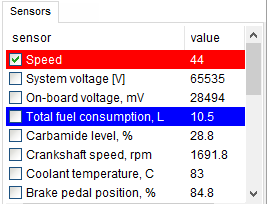
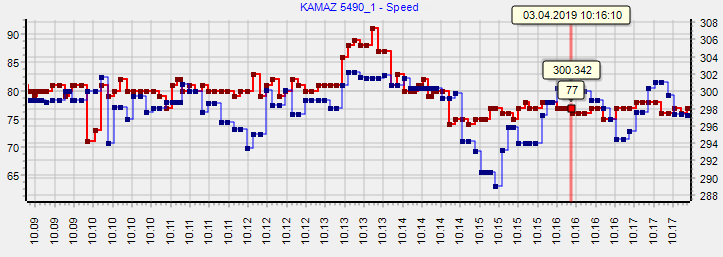
In the chart, only the data from sensors selected with a tick is displayed (the line with this sensor is indicated with red color in the list). In order to view two charts at the same time, you need to select a second sensor with mouse cursor (the line will be indicated with blue color).
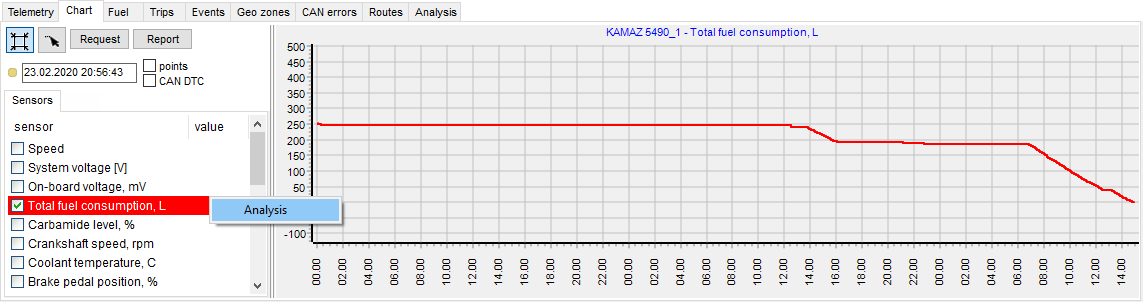
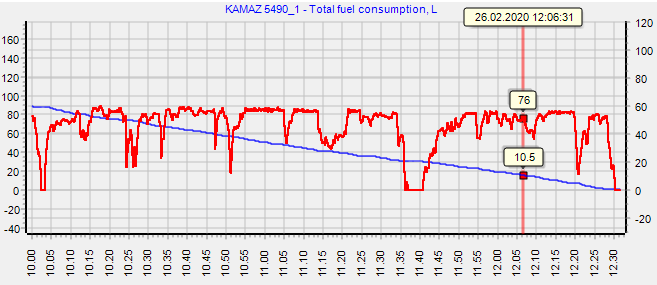
If some sensor from this list of sensors has the type CAN fuel consumption (you can check sensor type in Settings - Vehicle fleet - Sensors), thenthe button Analysis appears when this sensor is clicked as shown below:
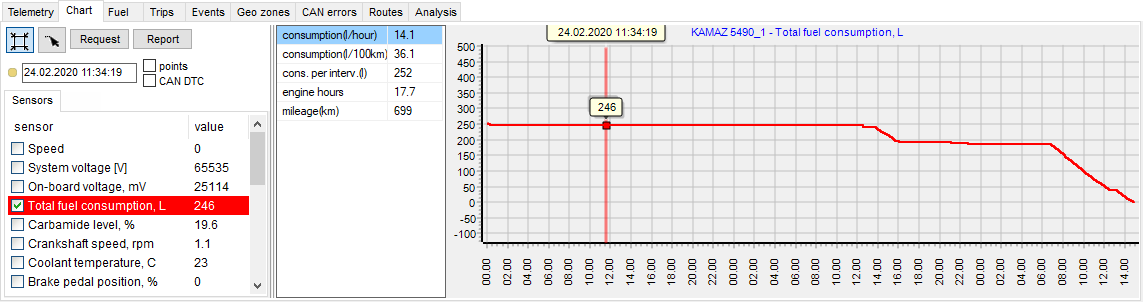
When you click Analysis, an additional column with data appears on the right, as shown below:
If some sensor from this list of sensors has the type fuel level (you can check sensor type in Settings - Vehicle fleet - Sensors), thenthe button Analysis appears when this sensor is clicked. When you click Analysis, the Fuel tab is shown.

 .
.