×
Menu

Report generation

 
You can open Report generation window with the help of the graphic icon Generate report in the Menu Bar . Report generation
1

Select an object

1. Select an object
In order to generate a report for a single object, you need to select the object in the vehicle fleet structure with the mouse.
In order to generate a report for a group of objects, you need to tick checkboxes of the required objects in the vehicle fleet structure.
2

Set time interval

2. Set time interval
You can set time interval according to the instruction given in the section Query Panel.
3

Select report type

3. Select report type
 
Report types:
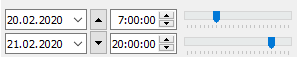
  • System reports: a catalog of reports generated by the system;
  • User-defined reports: a catalog of reports, made by the user;
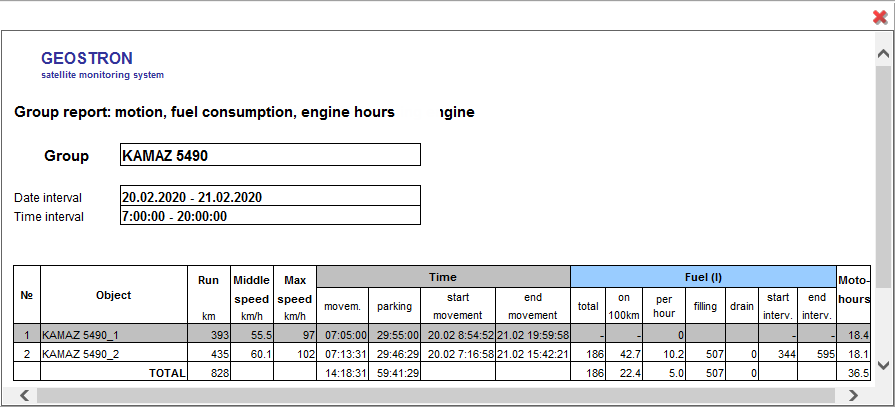
     
    Kinds of reports:
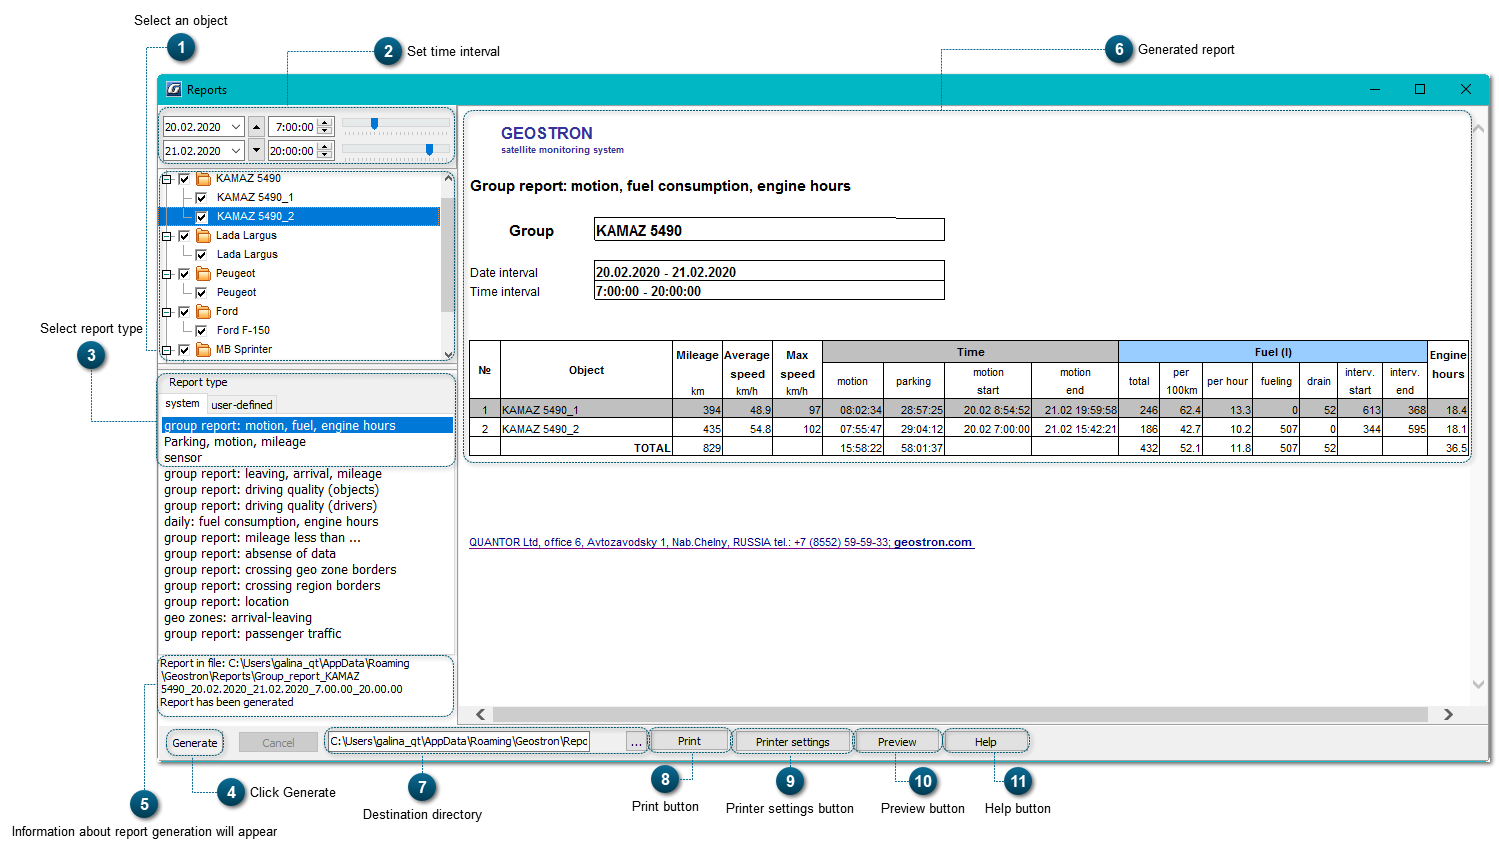
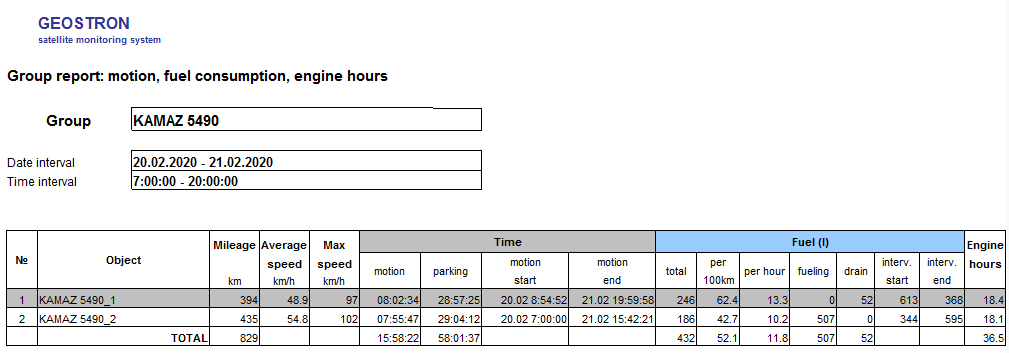
  • Group reports: a report is generated for the objects selected with a tick in the vehicle fleet structure;
  • Individual reports: a report is generated for a single object selected with the mouse in the vehicle fleet structure.
 
For the User-defined reports, there are additional tools for report generation:
 
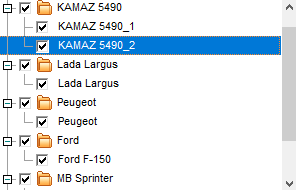
Daily report option allows to generate a daily report for the chosen time interval.
Time interval is an additional option of the daily report. It adds the time interval (hours/minutes/seconds) to the Date column of the report.
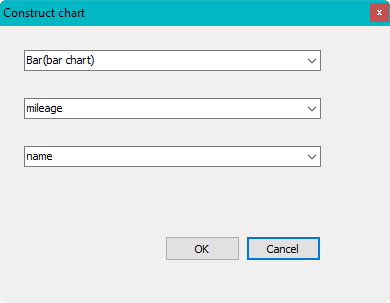
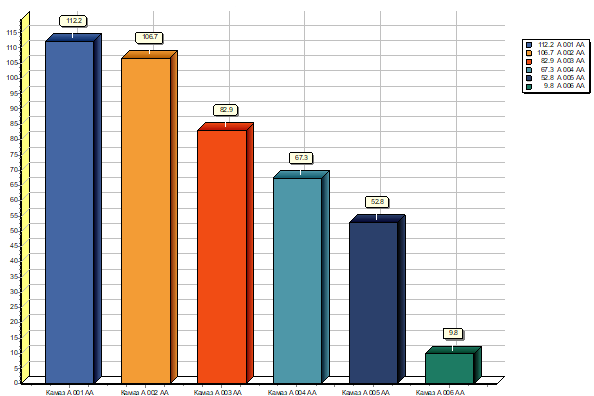
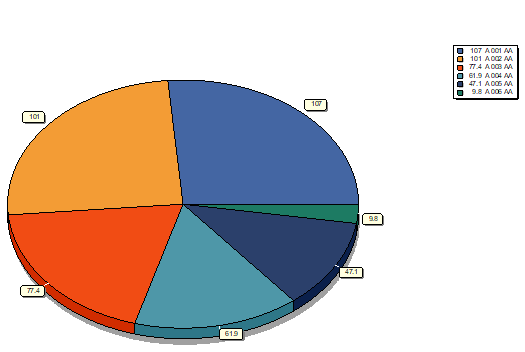
Chart: this option adds a chart to the generated report. Using the button Parameters, you can configure the area of the chart.
 
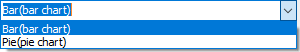
1. Select a kind of chart:
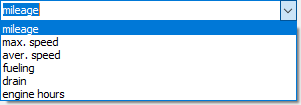
2. Select a value for the OY axis (values from the selected report are available):
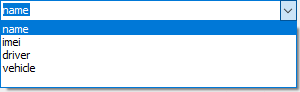
3.  Select a value for the OX axis (values from the selected report are available):
 
 Important: the Group report: crossing the geo zone borders should only be generated in case you have created at least one event "Object doesn't leave geo zone". See more about event creation in the section Event editor.
 
Reports generated in the Geostron client application can be imported in an ERP system.
4

Click Generate

4. Click Generate
5

Information about report generation will appear

5. Information about report generation will appear
6

Generated report

6. Generated report
7

Destination directory

7. Destination directory
 
Address bar where the directory of the report is displayed.
A report is saved in the directory that you have selected in the Settings (see the section Directories).
To change the destination directory, click and select the directory where you want the report to be saved.
8

Print button

8. Print button
Sends the generated report to printer.
9

Printer settings button

9. Printer settings button
Opens a window with additional printer settings.
10

Preview button

10. Preview button
Opens the generated report in the Telemetry Panel area:
To leave the preview mode, click   in the upper right corner of the panel.
11

Help button

11. Help button
Opens a window with instructions to this section.