You can change the size of this panel. To do this, move the mouse to the edge of the panel, and shift its border by dragging the mouse, as soon as you see the icon / .
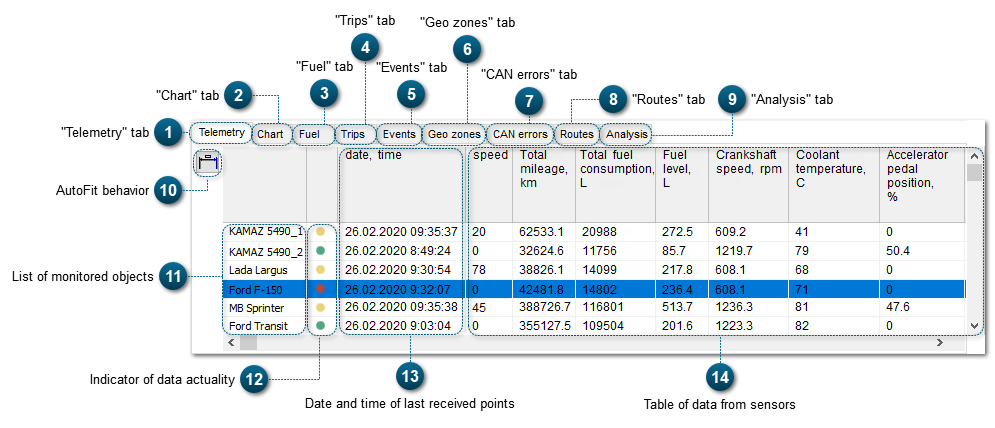
"Telemetry" tab
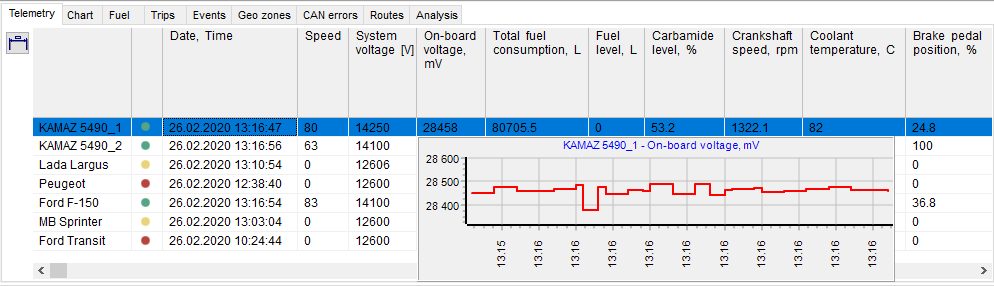
In the Telemetry tab, real-time data from sensors installed on monitored objects are displayed. To set the display of a certain set of sensors, see the section Settings - Telemetry.
It is also possible to change the size of table columns. To do this, move the mouse to the edge of a column and shift its border by dragging the mouse, as soon as you see the icon .
On the server, there are charts that display the changes of parameter values. You can request such a chart for some parameter if you double-click a box (object-sensor) in the table. When the chart is received, the system will show you the Chart tab automatically. Data will be requested for the time interval that you have set in the Query Panel.
The Fuel tab shows calculated data on total fuel consumption for a chosen time interval. In this tab, you can also see volume of fuelings and drains for a chosen time interval.
In the CAN errors tab, there is a list of diagnostic messages about detected errors from CAN-bus of the object. This information is available if the model of the tracking device can read codes of diagnostic errors.
In the Analysis tab, the system provides telematic information from a sensor for a chosen time interval. The system filters local parameter fluctuations and displays the result as a chart.
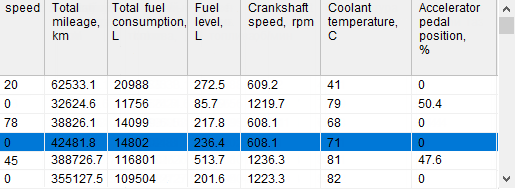
In this area, current data from sensors of selected monitored objects is displayed. You can change the settings for this table (what data from sensors will be displayed) in the telemetry settings (see the section Settings - Telemetry.
When you double-click a box with data, the panel switches to the Chart tab automatically, where you can see a chart with up-to-date data of the selected data type.
To air view a chart, you can press Ctrl button and move the mouse to the box you are interested in.