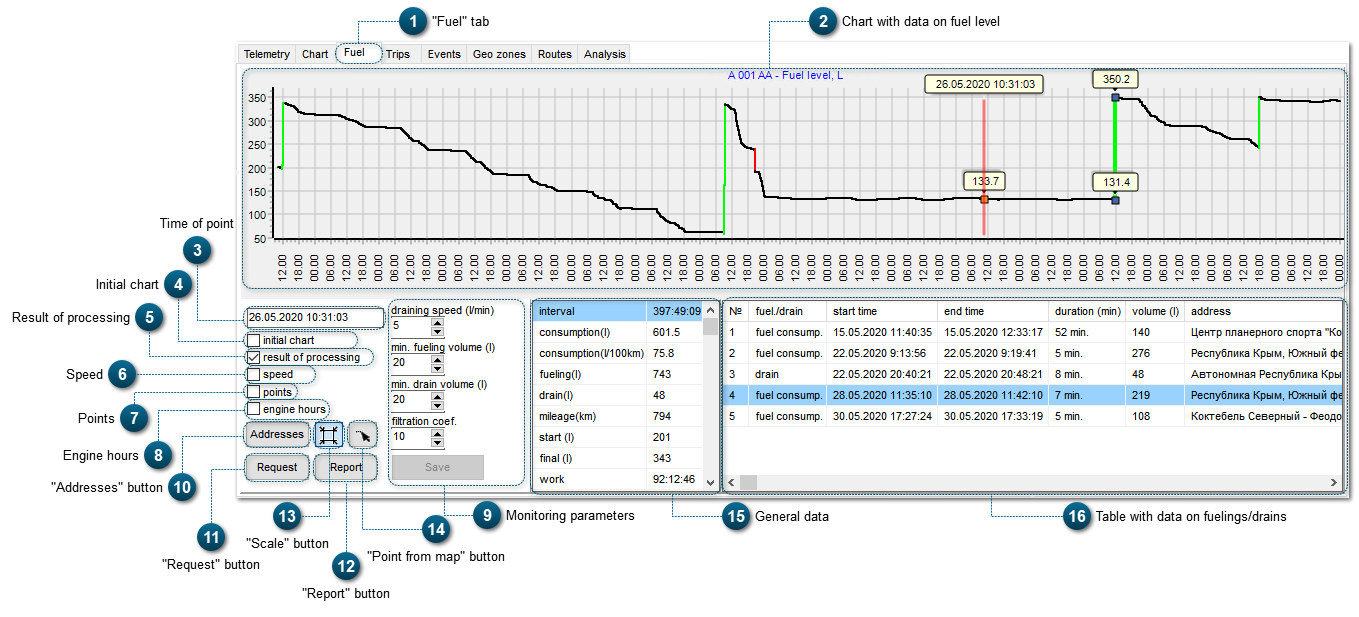
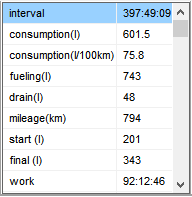
In the Fuel tab, calculated data on total fuel consumption for the chosen time interval, and also data on the amount of fuelings and drains is displayed.
in the chart area, right-click and drag frame area so that you choose some interval. After you do this, the map will be centered on the selected part of the track:
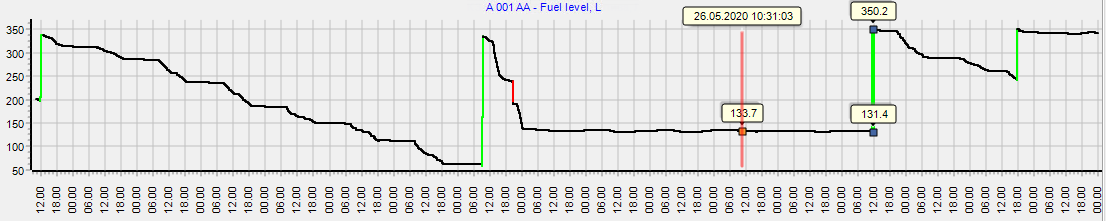
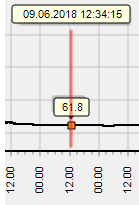
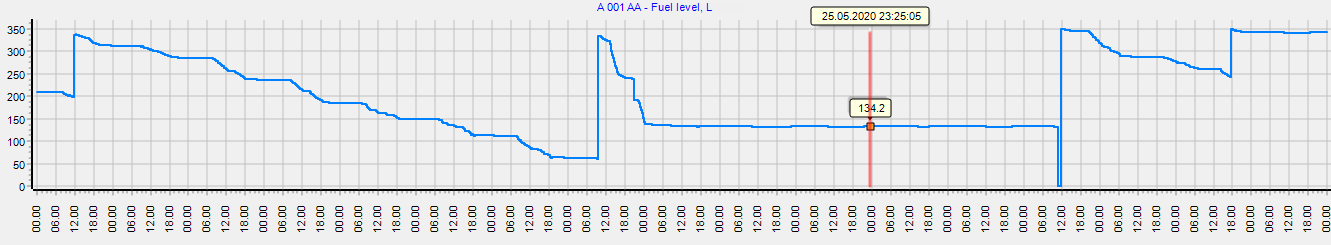
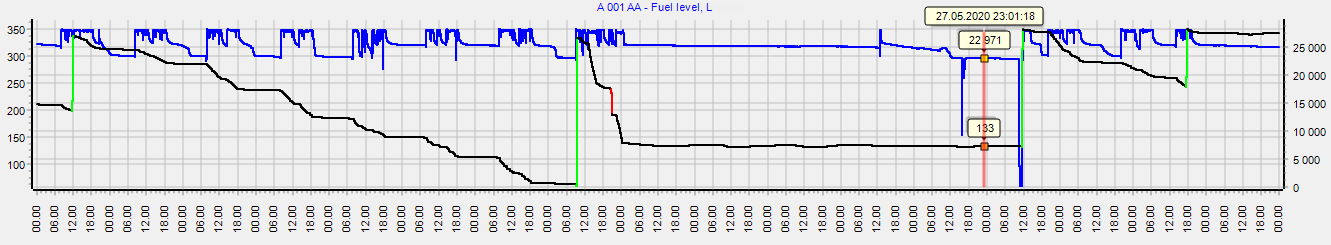
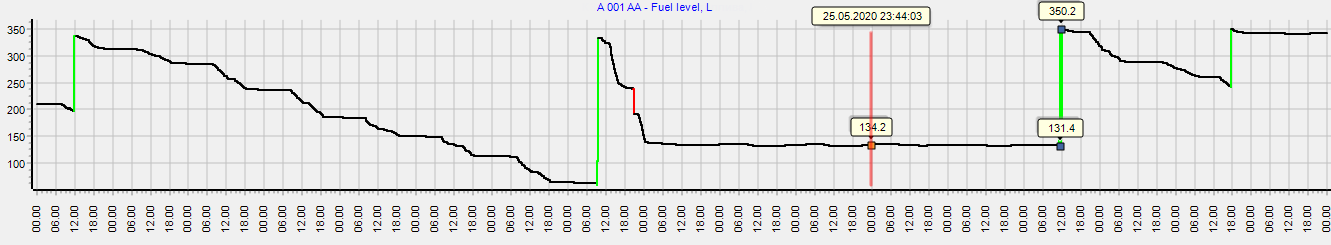
When you move the mouse cursor to the chart, data on fuel level at the selected time of track is displayed:
When you select this checkbox, chart with processed data on fuel consumption for a chosen time interval is displayed (by default, this checkbox is selected).
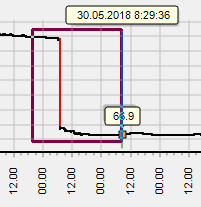
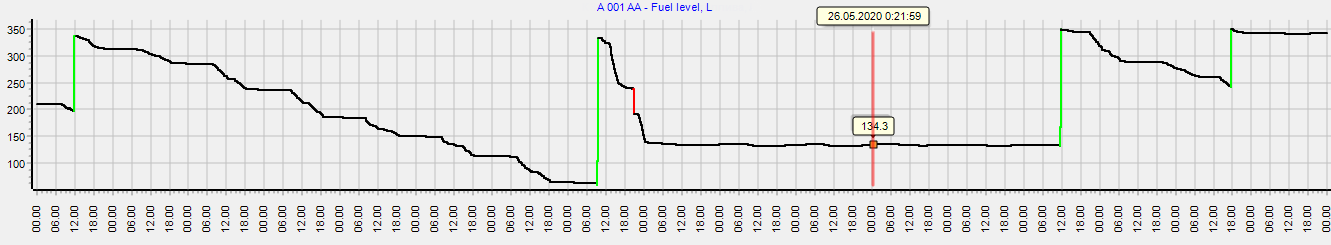
The red line in the chart is for fuel drains, the green line is for fuelings.
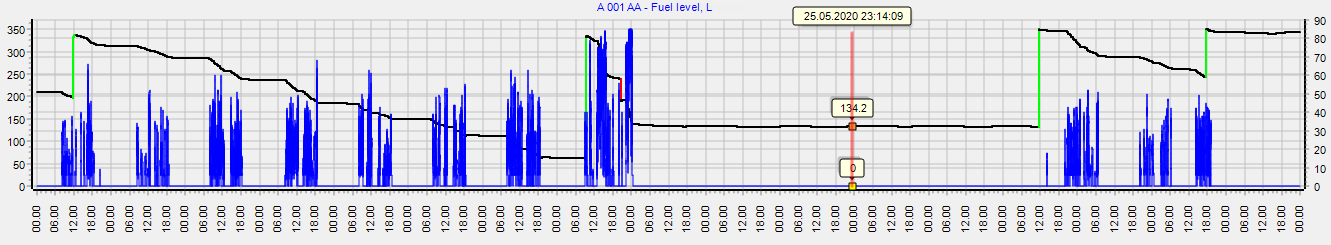
When you select this checkbox, an additional chart with data on the speed of the monitored object for the chosen time interval is displayed in the same chart.
In such a way you can see data on fuelings, drains and speed at the same time:
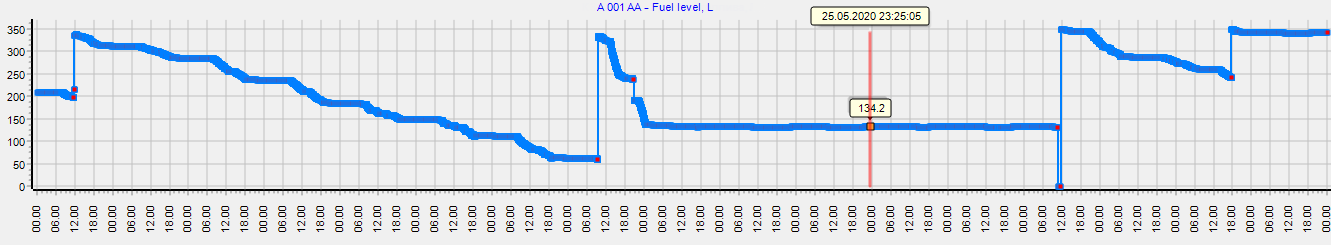
When you select this checkbox, you see a chart with points. Each of these points shows the time when the system received information from the fuel sensor(s), and fuel level at this time.
This function is only active when the Initial chartis activated (when the checkbox for the Initial chart is selected).
This button helps you to request address (location).
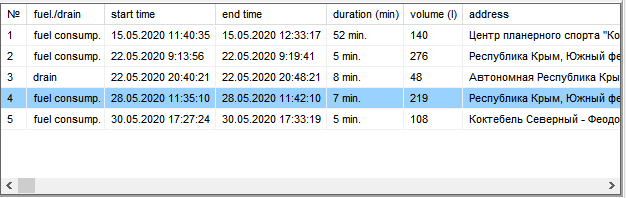
When you click Addresses, an additional column is added to the table of fuelings/drains. In this column, there are addresses (locations) of these events (fuelings/drains).
This button helps to generate a report based on the chart. The report contains time interval, chart and data on the object where the sensor is installed.
The report is saved in the directory that you can set using the section Settings - Directories.
When this function is activated: if you move the mouse in the chart of some parameter, object marker is positioned in the corresponding point of the track (object marker follows your mouse cursor). Also, the corresponding table row becomes selected in the Tracktab.
When this function is deactivated: you need to click some place in the chart in order to position the marker there.