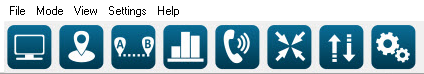
Menu Bar, Panels and Toolbar
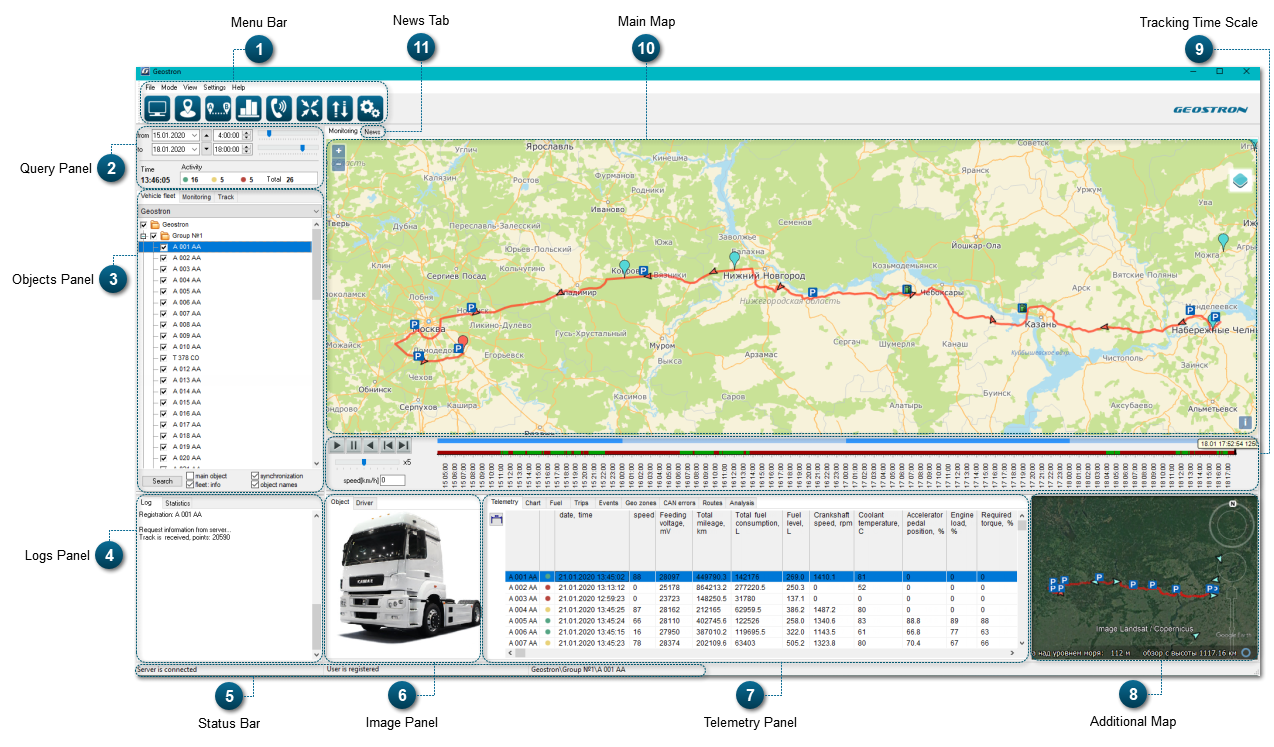
Query Panel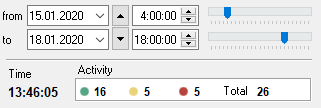 Query Panel allows to set time intervals used to get tracks, charts and create reports, and also helps to check if the data is current.
|
Objects Panel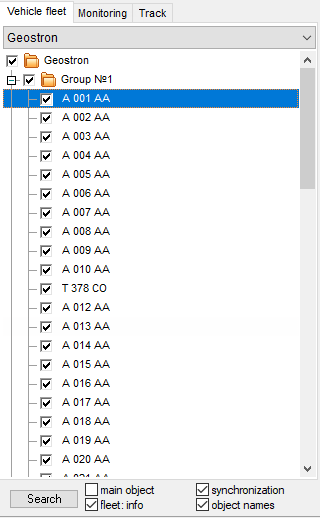 Objects Panel displays the hierarchical structure of a company's departments and vehicles. This panel includes a group of tabs allowing to control the monitoring process.
|
Logs Panel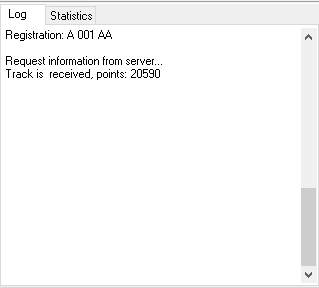 Logs Panel displays the user's commands and their results. Statistics Tab displays general information about the monitored object.
|
Status BarIn the Status Bar key events are displayed (the status of connection with the server, user status, active monitored object).
|
Image Panel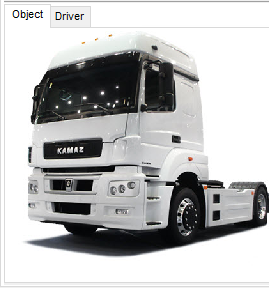 Image Panel displays general information about the monitored object and the driver. Camera Tab allows to see panoramic photographs of an area.
|
Telemetry Panel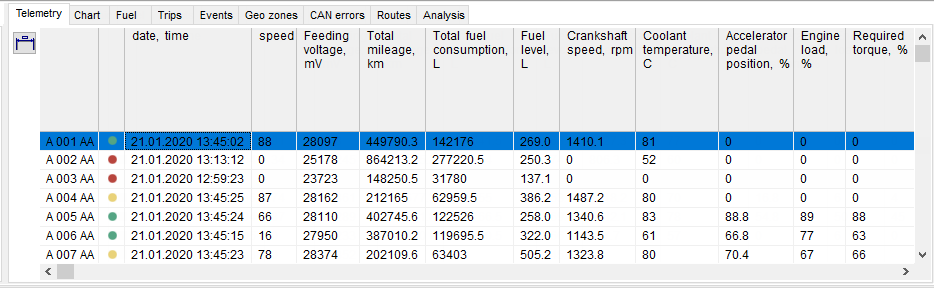 Telemetry Panel displays readings of sensors; this data is transmitted in real time from monitored objects.
|
Additional Map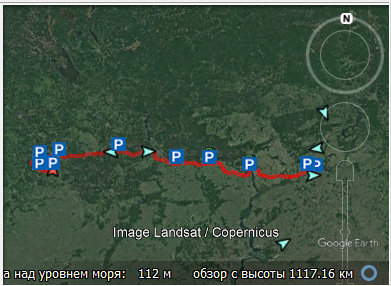 Additional Map is used to make visual control of monitored objects more convenient. Google Earth, OpenStreetMap or 2GIS can be used as an additional map.
|
Tracking Time Scale Tracking Time Scale is a player tool that shows the route of the controlled vehicle.
|
Main Map Main Map allows to exercise visual control over monitored objects. Google Earth, OpenStreetMap or 2GIS can be used as a main map. It is also possible to replace it with Additional Map.
|
News TabNews Tab shows a page on the website of the software company that designed this system. On this page, you can find information about latest updates or changes in the system, and other helpful information.
|